Using Excel Pivot Tables to Visualise British Official Publication Dates
Using the British Official Publications dataset, a member of the Library’s Digital Scholarship team demonstrated how Microsoft Excel can be used to prepare and visualise data.
After downloading the dataset the british_official_publications_descriptive_metadata.csv file was imported into a new workbook. The data were cleaned and prepared using the Excel Power Query Editor, which involved removing unnecessary columns and standardising the format of publication years.
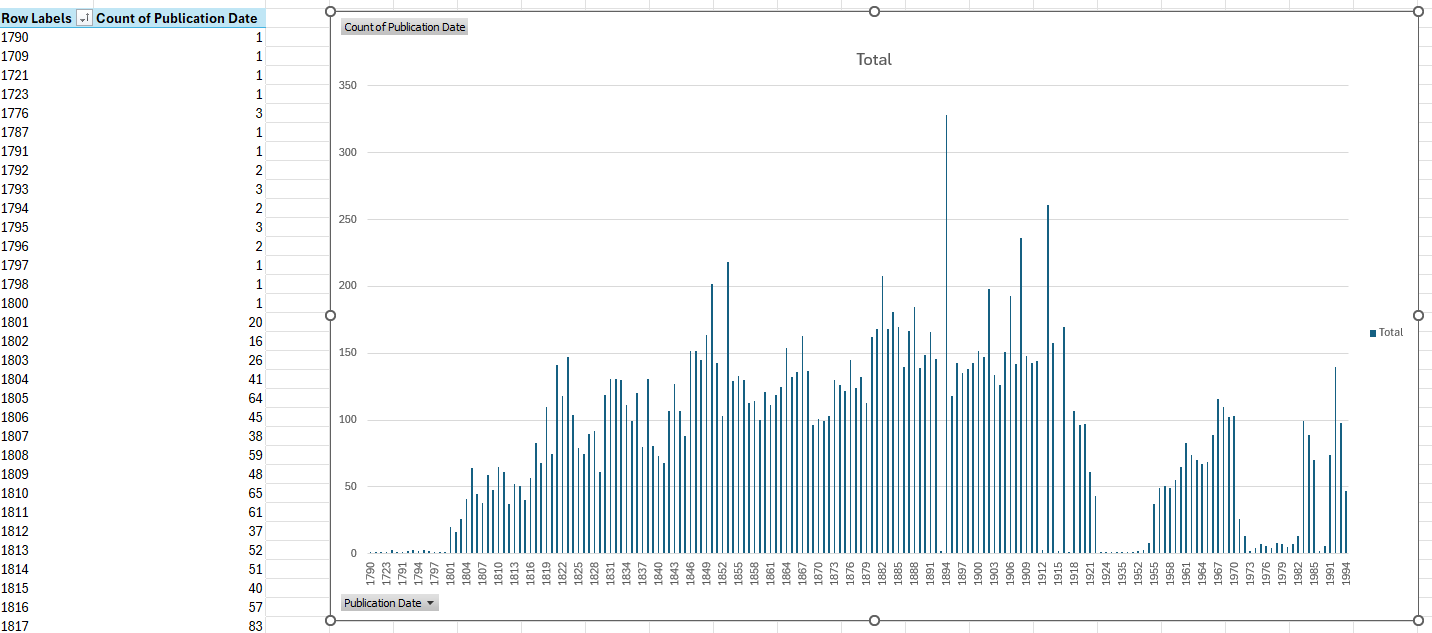
Once cleaned, the column containing publication dates was loaded into a pivot table, which was configured to count the number of publications per year. These counts were then visualised as a bar chart, providing an overview of publication dates in this collection.